GUIDE
How to Create a PRISMA 2020 Flow Diagram: A Step-by-Step Guide for Systematic Reviews
Published September 16, 2026
A practical guide to tracking study selection, avoiding common PRISMA reporting mistakes, and generating a flow diagram for your systematic review.
A systematic review does not begin with the final number of included studies.
It begins with a search strategy, thousands of possible records, duplicate citations, title-and-abstract screening, full-text assessment, and a series of documented decisions about which studies meet the review criteria.
A PRISMA 2020 flow diagram is the visual record of that journey.
It shows readers how many records were identified, how many duplicates were removed, how many reports were screened, why full-text reports were excluded, and how many studies were ultimately included in the review or meta-analysis.
For researchers, the challenge is usually not understanding that a PRISMA diagram is needed. The challenge is producing one accurately.
This guide explains what a PRISMA 2020 flow diagram includes, how to calculate each number, common mistakes to avoid, and how to create one using EvidenceFlow’s free PRISMA 2020 flow diagram generator.
What is a PRISMA 2020 flow diagram?
PRISMA stands for Preferred Reporting Items for Systematic Reviews and Meta-Analyses.
The PRISMA 2020 flow diagram is a standardized visual summary of how studies moved through a systematic review. It helps readers understand the evidence-selection process and assess whether the review was conducted transparently.
A typical diagram follows four broad stages:
- Identification: Records found through databases, registers, websites, citation searching, or other sources.
- Screening: Records assessed at title-and-abstract level after duplicates and clearly ineligible records are removed.
- Eligibility: Full-text reports assessed against the review’s inclusion and exclusion criteria.
- Included: Studies that enter the final review and, where appropriate, the meta-analysis.
The diagram is not just a publication formality. It is a concise audit trail of the decisions that shaped the evidence base.
Why PRISMA tracking becomes difficult
Many review teams create the PRISMA diagram only when they are close to submitting their manuscript.
By then, citations may have been imported from multiple databases, duplicates may have been deleted at different points, reviewers may have used several spreadsheets, and full-text exclusion reasons may not have been recorded consistently.
This can lead to problems such as:
- Included-study counts that do not match the extraction table.
- Incorrect duplicate-removal numbers.
- Missing full-text exclusion reasons.
- Confusion between records, reports, and studies.
- A flow diagram that does not match the methods section.
- PRISMA counts reconstructed from memory rather than from a review record.
The easiest way to avoid these problems is to track decisions as they happen—not after the review is finished.
Step 1: Record every source of evidence
Start by documenting where your records came from.
Your identification stage may include:
- Bibliographic databases such as PubMed, Embase, Scopus, Web of Science, or Cochrane Library.
- Clinical-trial registers.
- Preprint servers.
- Reference-list screening.
- Citation tracking.
- Organizational websites.
- Grey-literature sources.
- Contact with experts or study authors.
At this stage, record the number of records retrieved from each source before deduplication. For example:
| Source | Records identified |
|---|---|
| PubMed | 850 |
| Embase | 1,120 |
| Scopus | 640 |
| Citation searching | 42 |
| Clinical-trial register | 18 |
| Total | 2,670 |
Keeping source counts from the beginning makes it easier to describe your search process in the methods section and complete the identification portion of the PRISMA diagram accurately.
Step 2: Remove duplicate records
Duplicate citations are common when the same article appears in multiple bibliographic databases.
A duplicate may have an identical DOI or PMID, but some duplicates are harder to identify because titles, author names, dates, punctuation, or journal metadata differ slightly across sources.
Before screening begins, record:
- Total records identified.
- Duplicates removed.
- Records removed for other clearly documented reasons before screening, if applicable.
- Records remaining for title-and-abstract screening.
Using the previous example:
2,670 records identified − 470 duplicate records = 2,200 records screened
This number—2,200—should become the starting point for your title-and-abstract screening stage.
EvidenceFlow can help teams centralize imported citations, identify duplicates, and retain the study-selection record within the same review project.
Step 3: Screen titles and abstracts
During title-and-abstract screening, reviewers decide whether each record appears potentially eligible based on the predefined inclusion and exclusion criteria.
Typical decisions include:
- Include: The record appears relevant and should proceed to full-text review.
- Exclude: The record clearly does not meet the eligibility criteria.
- Maybe: The abstract contains insufficient information and should be reviewed further.
At the end of this stage, record:
- Number of records screened.
- Number of records excluded.
- Number of records moved to full-text retrieval.
For example:
| Title-and-abstract screening outcome | Number |
|---|---|
| Records screened | 2,200 |
| Records excluded | 1,930 |
| Reports sought for retrieval | 270 |
The numbers should reconcile:
2,200 screened − 1,930 excluded = 270 reports sought
If the total does not reconcile, pause and identify the missing records before progressing.
Step 4: Document full-text retrieval and eligibility
Potentially relevant records should move to full-text assessment.
However, not every article is available immediately. Some reports may be inaccessible, unavailable through institutional access, missing from an archive, or impossible to retrieve after reasonable effort.
Record:
- Reports sought for retrieval.
- Reports not retrieved.
- Full-text reports assessed for eligibility.
- Full-text reports excluded.
- Reasons for full-text exclusion.
Common full-text exclusion reasons include:
- Incorrect population.
- Incorrect intervention or exposure.
- Ineligible comparator.
- Outcome not reported.
- Wrong study design.
- Duplicate publication.
- Conference abstract only.
- Insufficient data for the planned synthesis.
- Review article rather than an eligible primary study.
For example:
| Full-text outcome | Number |
|---|---|
| Reports sought for retrieval | 270 |
| Reports not retrieved | 12 |
| Full-text reports assessed | 258 |
| Reports excluded | 212 |
| Studies included in review | 46 |
The exclusion reasons should add up to the total number of full-text reports excluded:
| Reason for full-text exclusion | Number |
|---|---|
| Wrong population | 74 |
| Wrong intervention | 51 |
| Wrong study design | 39 |
| Outcome not reported | 28 |
| Insufficient extractable data | 20 |
| Total excluded full texts | 212 |
This detail is important because PRISMA reporting is intended to show not only how many reports were excluded, but also why they did not meet the protocol.
Step 5: Distinguish records, reports, and studies
One of the most common PRISMA mistakes is treating the words record, report, and study as though they mean the same thing.
They do not.
- A record is a bibliographic entry found through a search—for example, a PubMed citation.
- A report is a full-text publication or document.
- A study is the underlying investigation.
One study may produce multiple reports. For example, a randomized controlled trial may have a conference abstract, a primary results paper, a long-term follow-up publication, and a subgroup analysis.
If multiple reports describe the same underlying study, your review team should link them correctly rather than counting them as independent studies in the meta-analysis.
EvidenceFlow’s project-based workflow can help teams retain this connection from screening through data extraction and analysis.
Step 6: Report automation transparently
Automation and AI tools are increasingly used to support literature screening.
They may help with duplicate identification, study prioritization, metadata classification, or suggested screening decisions. But when automation is used, researchers should describe its role clearly in the review methods.
A transparent report should explain:
- Which task involved automation.
- Whether AI was used for prioritization, recommendation, or exclusion.
- Whether human reviewers made the final decision.
- Whether dual independent screening was maintained.
- How potentially relevant studies were protected from accidental exclusion.
AI should be treated as decision support—not as an invisible replacement for reviewer judgment.
With EvidenceFlow, AI-assisted screening can suggest Include, Exclude, or Maybe decisions with an explanation and confidence signal. Reviewers retain control over the final study-selection decision.
Step 7: Generate your PRISMA 2020 diagram
Once your numbers have been checked, you can create the diagram.
You can use EvidenceFlow’s free PRISMA 2020 flow diagram generator to enter your review counts and export a diagram for your manuscript, thesis, preprint, protocol, or supplementary materials.
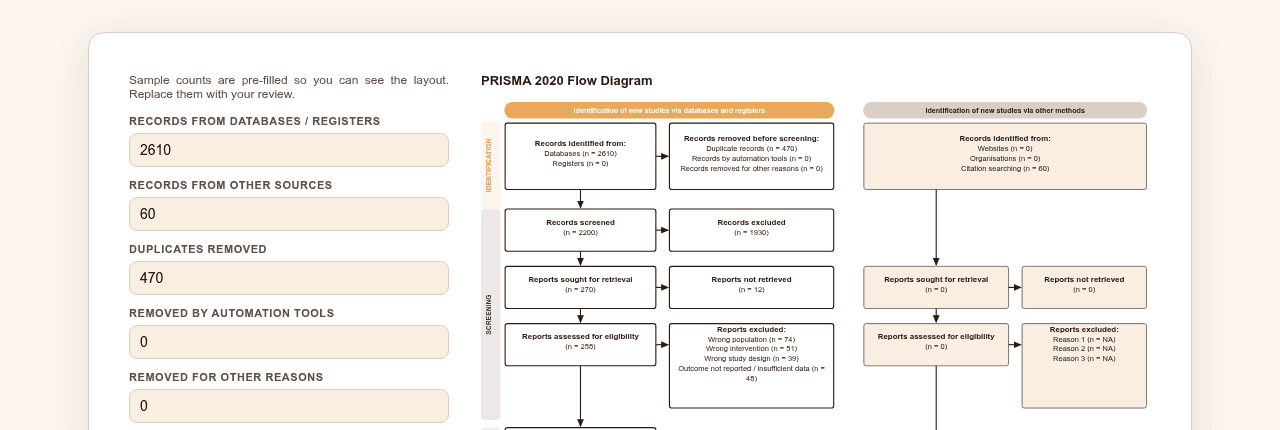
Before exporting, check that:
- The total records identified matches the sum of all search sources.
- Duplicate removals are documented.
- Screening totals reconcile at each stage.
- The number of reports assessed for eligibility is correct.
- Full-text exclusion reasons add up correctly.
- The number of included studies matches your study-characteristics table.
- The number of studies in the meta-analysis matches your analysis dataset.
- Your PRISMA diagram is consistent with your methods and results sections.
A simple PRISMA example
Imagine a team conducting a systematic review of an intervention for postoperative pain.
The search finds 2,670 records. After removing 470 duplicates, the team screens 2,200 titles and abstracts. Of these, 1,930 are excluded. The team attempts to retrieve 270 full-text reports, but 12 cannot be obtained. After assessing 258 full texts, the researchers exclude 212 reports for documented reasons and include 46 studies in the qualitative synthesis.
Of those 46 studies, 31 report compatible numerical outcomes and are included in the meta-analysis.
The final PRISMA pathway would be:
2,670 → 2,200 → 270 → 258 → 46 → 31
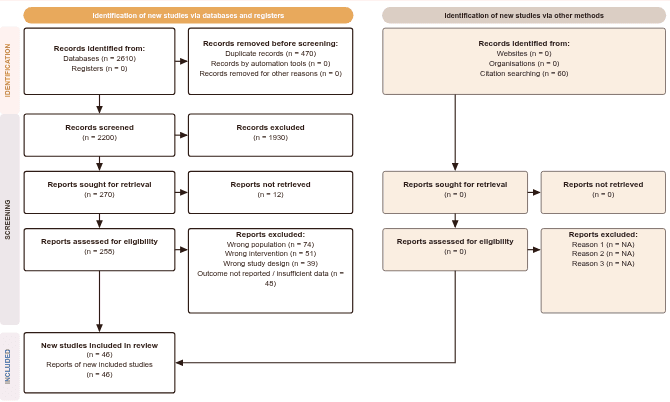
That sequence gives readers a concise, transparent explanation of how the final evidence base was selected.
Make PRISMA reporting part of the workflow
The best time to create a PRISMA diagram is not necessarily at the end of the project.
It is at the beginning—by setting up a workflow that records identification, duplicate removal, screening, full-text decisions, exclusions, and included studies as they happen.
A connected workspace helps reduce manual counting, keeps reviewer decisions organized, and makes the final reporting process easier to verify.
EvidenceFlow brings literature import, screening, structured extraction, meta-analysis, and PRISMA-oriented reporting into a single review workspace.
Create your PRISMA 2020 flow diagram
Ready to document your review clearly?
EvidenceFlow supports systematic-review screening, collaborative workflows, data extraction, meta-analysis, and PRISMA-oriented reporting. AI-supported features are designed to assist reviewers; final methodological decisions remain the responsibility of the research team.